
Flooding is the most frequent severe-weather related threat and the costliest natural disaster in the United States. To improve flood warning communication and help emergency managers prepare for and respond to flooding, the National Weather Service (NWS) has begun to add new experimental flood inundation mapping services to its suite of forecast products. These new services complement and support the issuance of flood watches and warnings by providing near-real-time, high-resolution, street-level visualizations showing where, when, and how much flood waters are forecast.
“This new inundation modeling capability provides actionable information for emergency and water resource managers to prepare, mitigate and respond to flood impacts,” said David Vallee, director, Service Innovation and Partnership Division, NOAA’s National Water Center. “These services will dramatically improve our ability to provide impact-based decision support services to our partners so they can preposition people and resources ahead of flood events.”
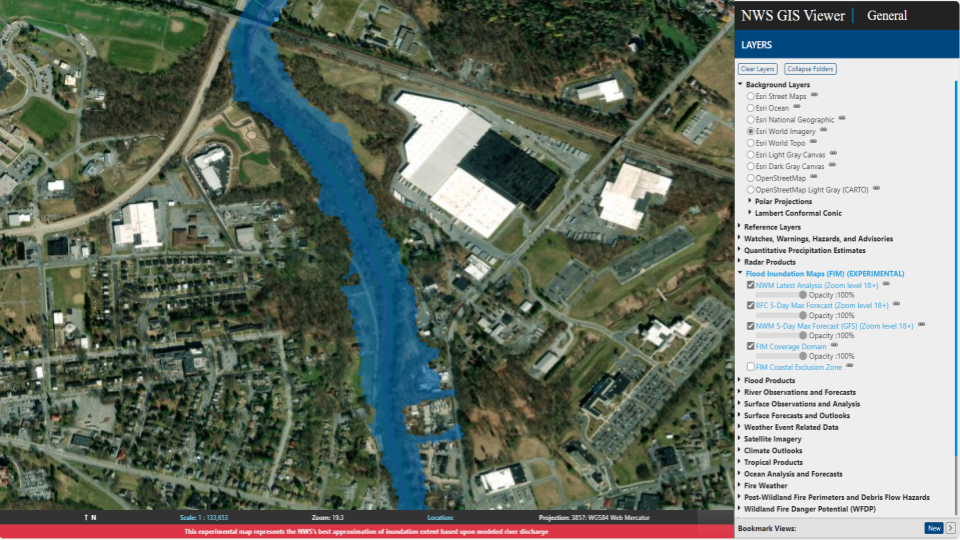 |
| NWS’s new experimental flood inundation maps help communicate the timing and magnitude of high water events by showing modeled inundated areas in blue overlay. Emergency managers may use these services to preposition resources, secure critical infrastructure and recommend evacuations and evacuation routes. Credit: NOAA |
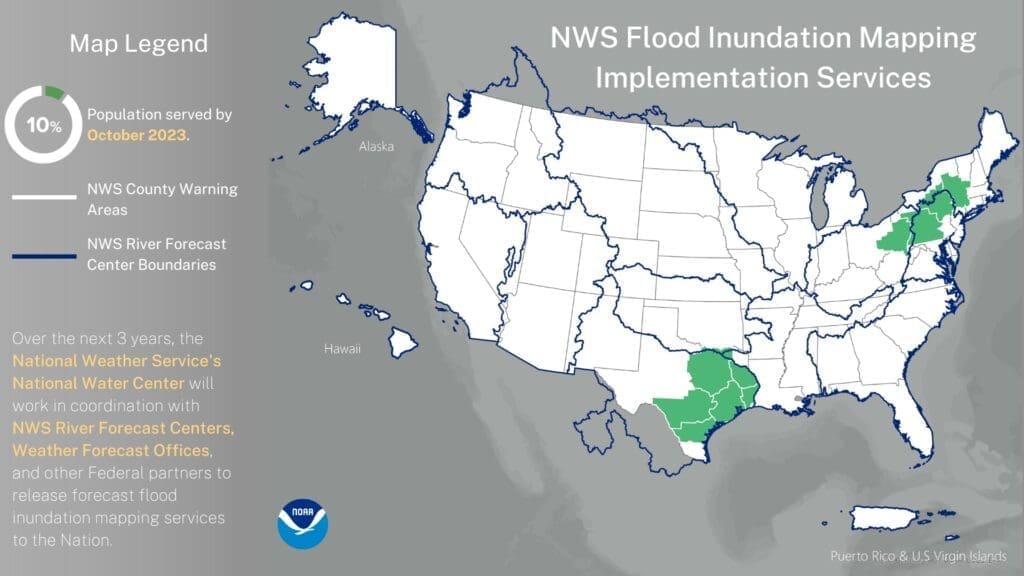
The new services are now available, providing initial mapping capabilities for 10% of the U.S. population, or more than 30 million people, in much of eastern Texas and parts of the mid-Atlantic and Northeast. These areas were selected to receive the first phase of flood inundation maps based on the potential for flooding, vulnerable populations, and local participation in NOAA demonstrations of these capabilities, including flooding tabletop exercises. NOAA’s National Weather Service is seeking public comments on the new experimental services through September 30, 2024.
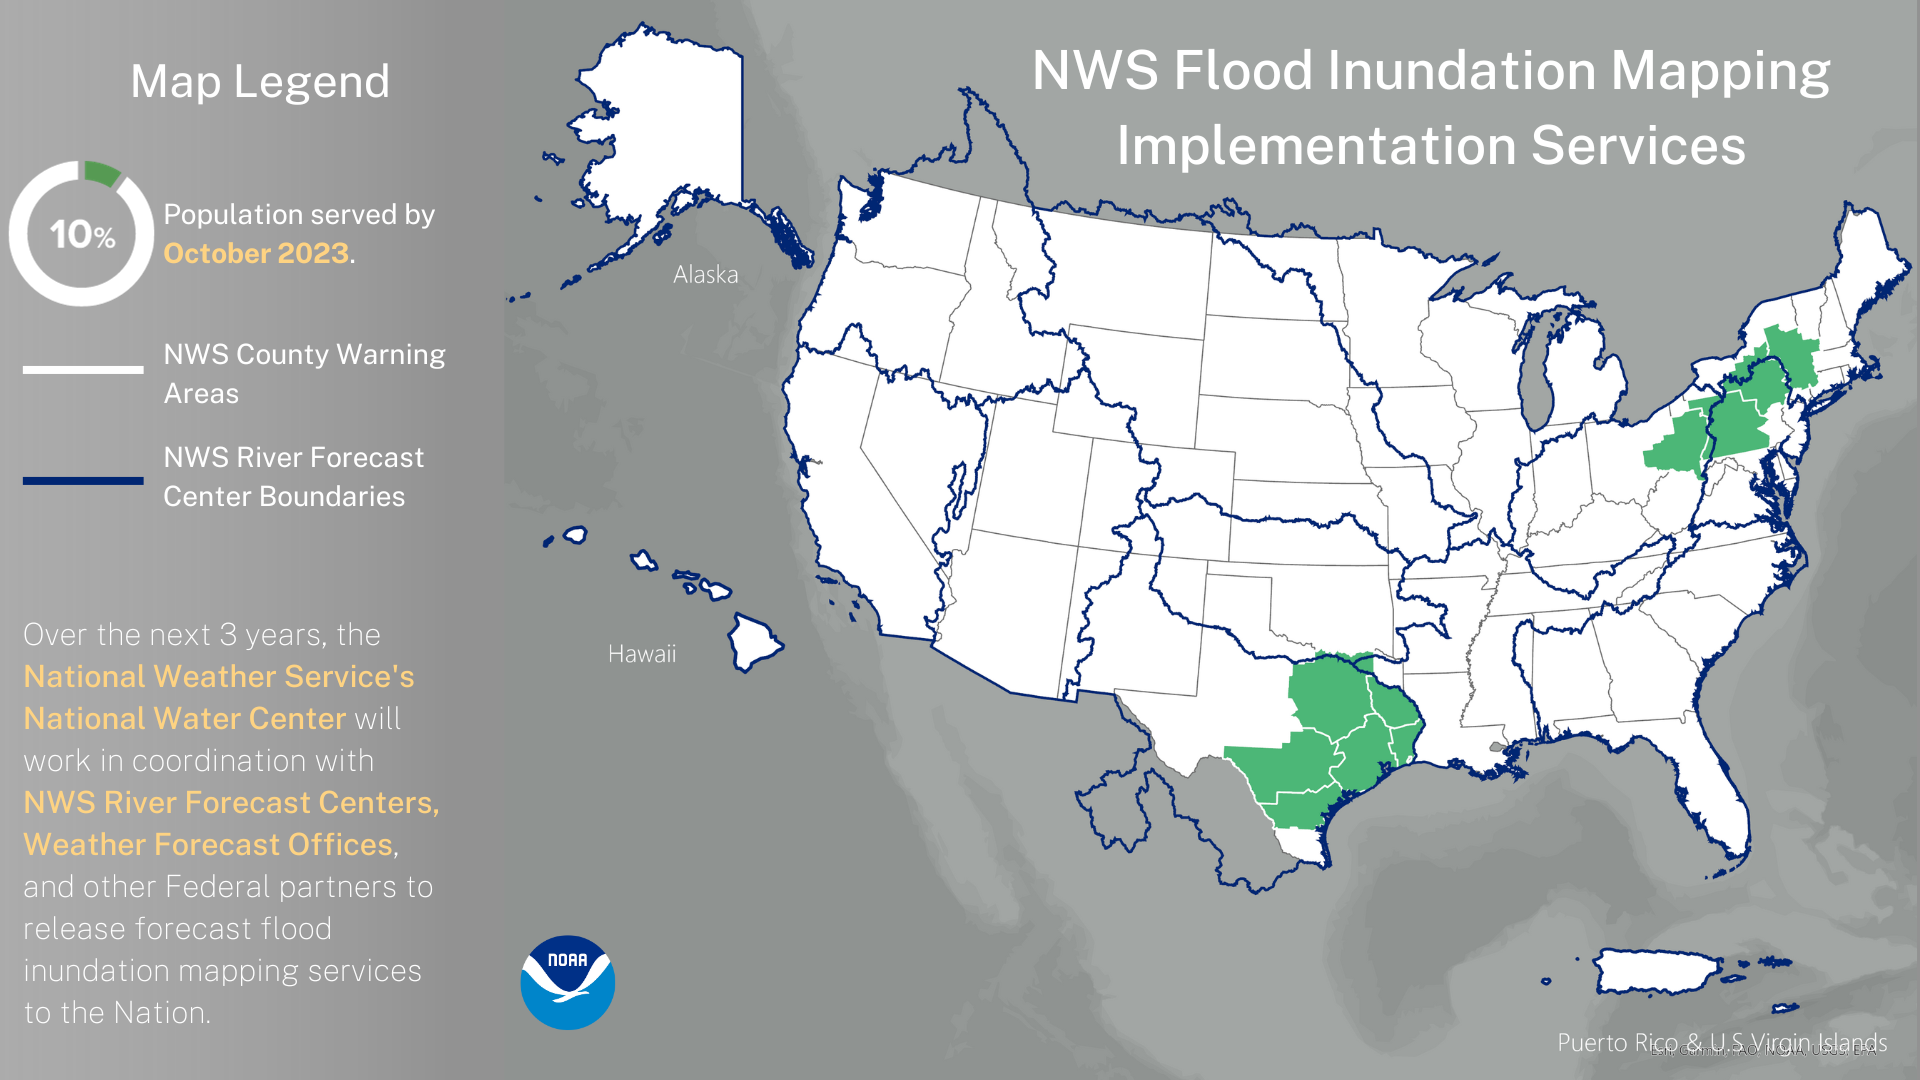 |
| Areas in green – much of eastern Texas, central Pennsylvania and parts of the Northeast – are where NWS’s new experimental flood inundation services are available for more than 30 million people beginning September 26, 2023. Credit NOAA |
NWS’s new services for flood impact information include three near-real-time products:
- National Water Model Hourly Analysis shows flood inundation extent based on the National Water Model hourly streamflow analysis, where the National Water Model analyzes flows at or above a high water threshold.
- National Water Model 5-Day Maximum Flood Inundation Forecast shows the maximum inundation extent over the next five days derived from the National Water Model streamflow forecast. This service is available where and when the National Water Model forecasts flows that meet or exceed the high water threshold for a given river reach.
- River Forecast Center 5-Day Maximum Flood Inundation Forecast provides a 5-day forecast of flood inundation extent based on the streamflow predictions from an NWS River Forecast Center. This forecast is generated anytime a forecast point location is predicted to reach or exceed the action stage.
The NWS will expand its Flood Inundation Mapping services to include 30% of the U.S. population in 2024, 60% in 2025, and 100% in 2026. Additional Flood Inundation Mapping products will be introduced in future releases. When fully deployed in 2026, flood inundation mapping will be available for 110,000 river miles near NWS River Forecast Center forecast point locations, and for 3.4 million river miles covered by National Water Model forecasts.
The maps can be viewed in the NWS National Viewer. The information is also provided as a standard GIS web service format that allows for easy integration into GIS applications used by emergency and water managers. The National Water Center operations webpage has more information about access to the visualizations.
To develop the new maps, NOAA’s National Water Center worked in coordination with the National Weather Service’s River Forecast Centers and Weather Forecast Offices along with Federal and other partners. New flood inundation mapping services leverage the Height Above Nearest Drainage (HAND) method, which is a low-complexity, terrain-based approach for inundation mapping. It uses the Digital Elevation Model (DEM) produced by the U.S. Geological Survey’s (USGS) 3DElevation Program and the NHDPlus Hydrography stream network dataset produced by the USGS to create a “hydrofabric.” The hydrofabric represents the land surface elevations at the 10 meter resolution, consistent with the location of the stream and river channel network represented as vectors or lines.
NOAA’s new experimental Flood Inundation Maps and forecasting services are funded in part by the Bipartisan Infrastructure Law, as are next-generation water modeling activities, including modernized precipitation frequency and probable maximum studies. Please visit the Bipartisan Infrastructure Law website to learn about other current and future funding opportunities.
Resources: Story Map on new Flood Inundation Maps and services